Discrete Water Quality Report
Introduction
The Department of Water Resources (DWR) and the US Bureau of Reclamation (USBR) are required by Water Right Decision 1641 (D-1641) to collect discrete water chemistry data to monitor the water quality at select sites in the upper San Francisco Estuary (Estuary). This report describes the results of these monitoring efforts for water year 2024 (October 1st 2023 through September 30th 2024) which was classified as above normal in the Sacramento and San Joaquin Valleys (source). Results are compared to the previous water year, which was classified as wet in both valleys.
Methods
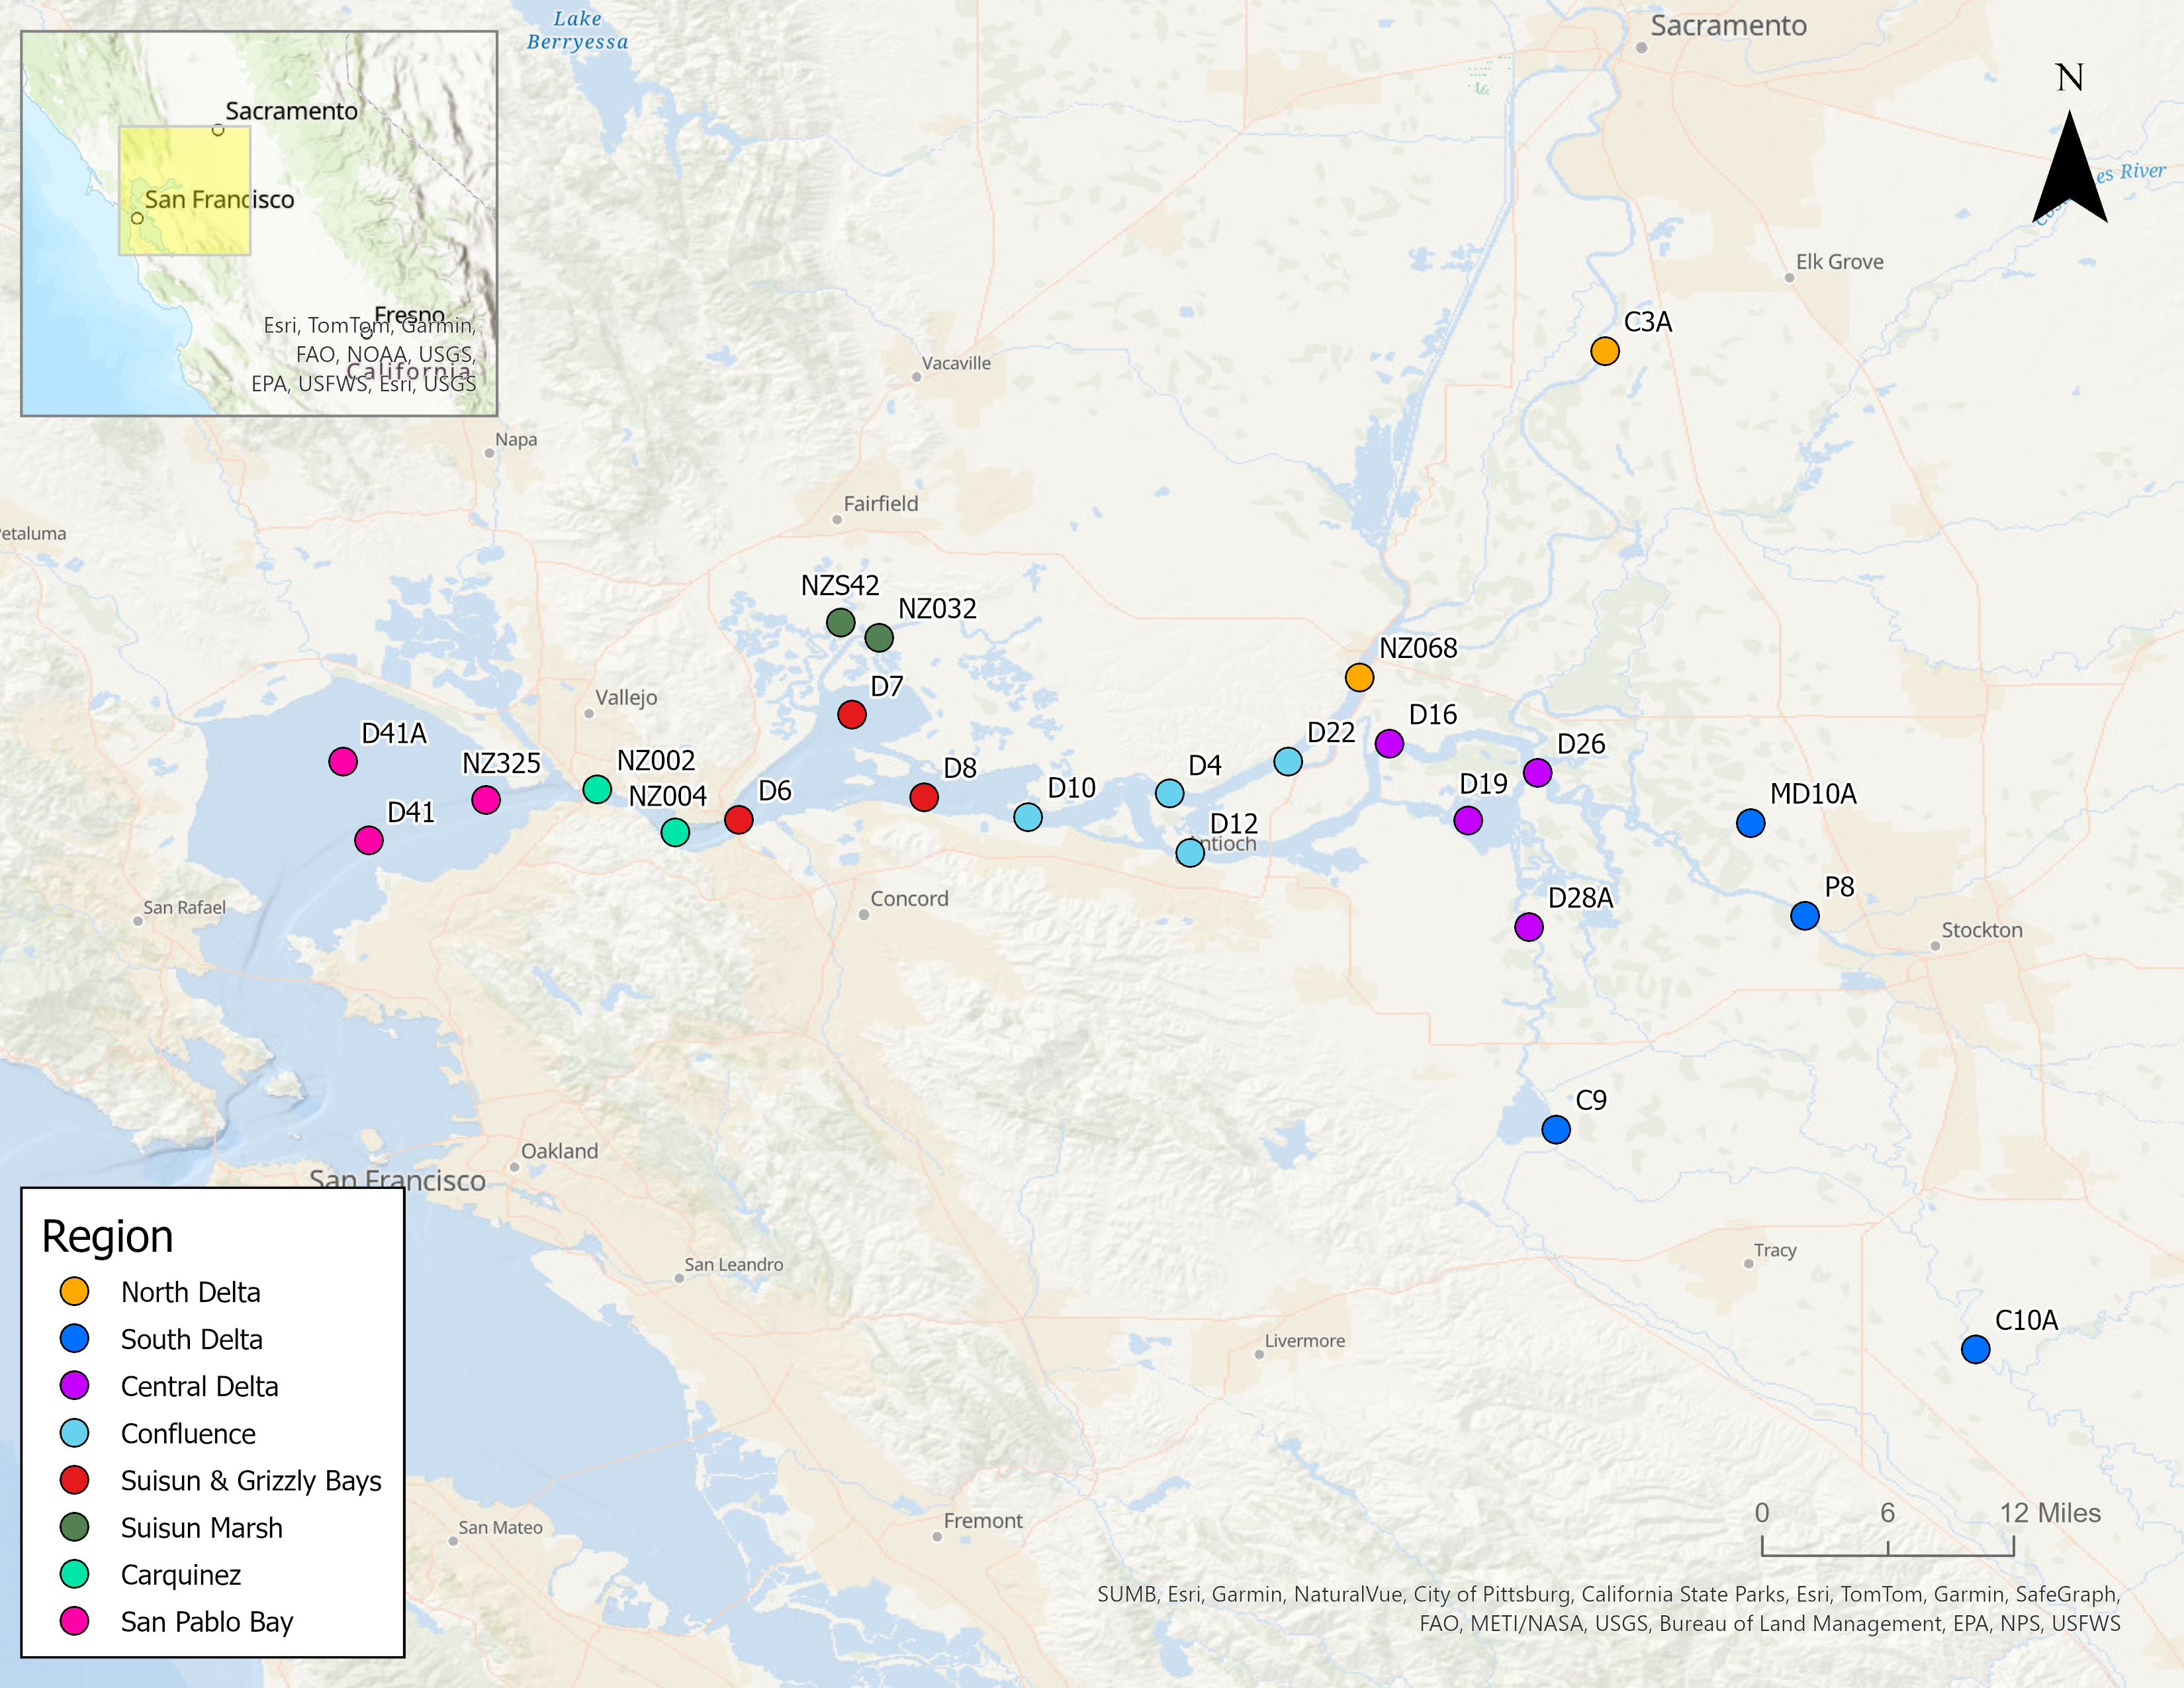
Discrete water quality samples were collected monthly at 24 monitoring sites throughout the Upper Estuary and were grouped into regions based on their geographic location (Figure 1; Table 1). These sites represent a variety of aquatic habitats, from narrow, freshwater channels to broad, estuarine bays.
| Region | WY Index | Stations |
|---|---|---|
| Carquinez | Sacramento | NZ002, NZ004 |
| Central Delta | San Joaquin | D16, D19, D26, D28A |
| Confluence | Sacramento | D4, D10, D12, D22 |
| North Delta | Sacramento | C3A, NZ068 |
| San Pablo Bay | Sacramento | D41, D41A, NZ325 |
| South Delta | San Joaquin | C9, C10A, MD10A, P8 |
| Suisun and Grizzly Bays | Sacramento | D6, D7, D8 |
| Suisun Marsh | Sacramento | NZ032, NZS42 |
EMP collects data for six different field parameters and 18 different laboratory constituents. The analytes highlighted in this report are:
- Specific Conductance (μS/cm)
- Turbidity (FNU)
- Dissolved Ammonia (mg/L)
- Chlorophyll a (μg/cm)
- Dissolved Nitrate+Nitrite (mg/L)
- Total Phosphorus (mg/L)
Regional facet graphs were created for each parameter. The average, minimum and maximum values were determined for each analyte. Non-detect values were represented graphically via a vertical dashed line capped at the reporting limit. Average summary statistics are reported as the median (M) ± the median average deviation.
For more in-depth methodology, see here.
Results
Specific Conductance
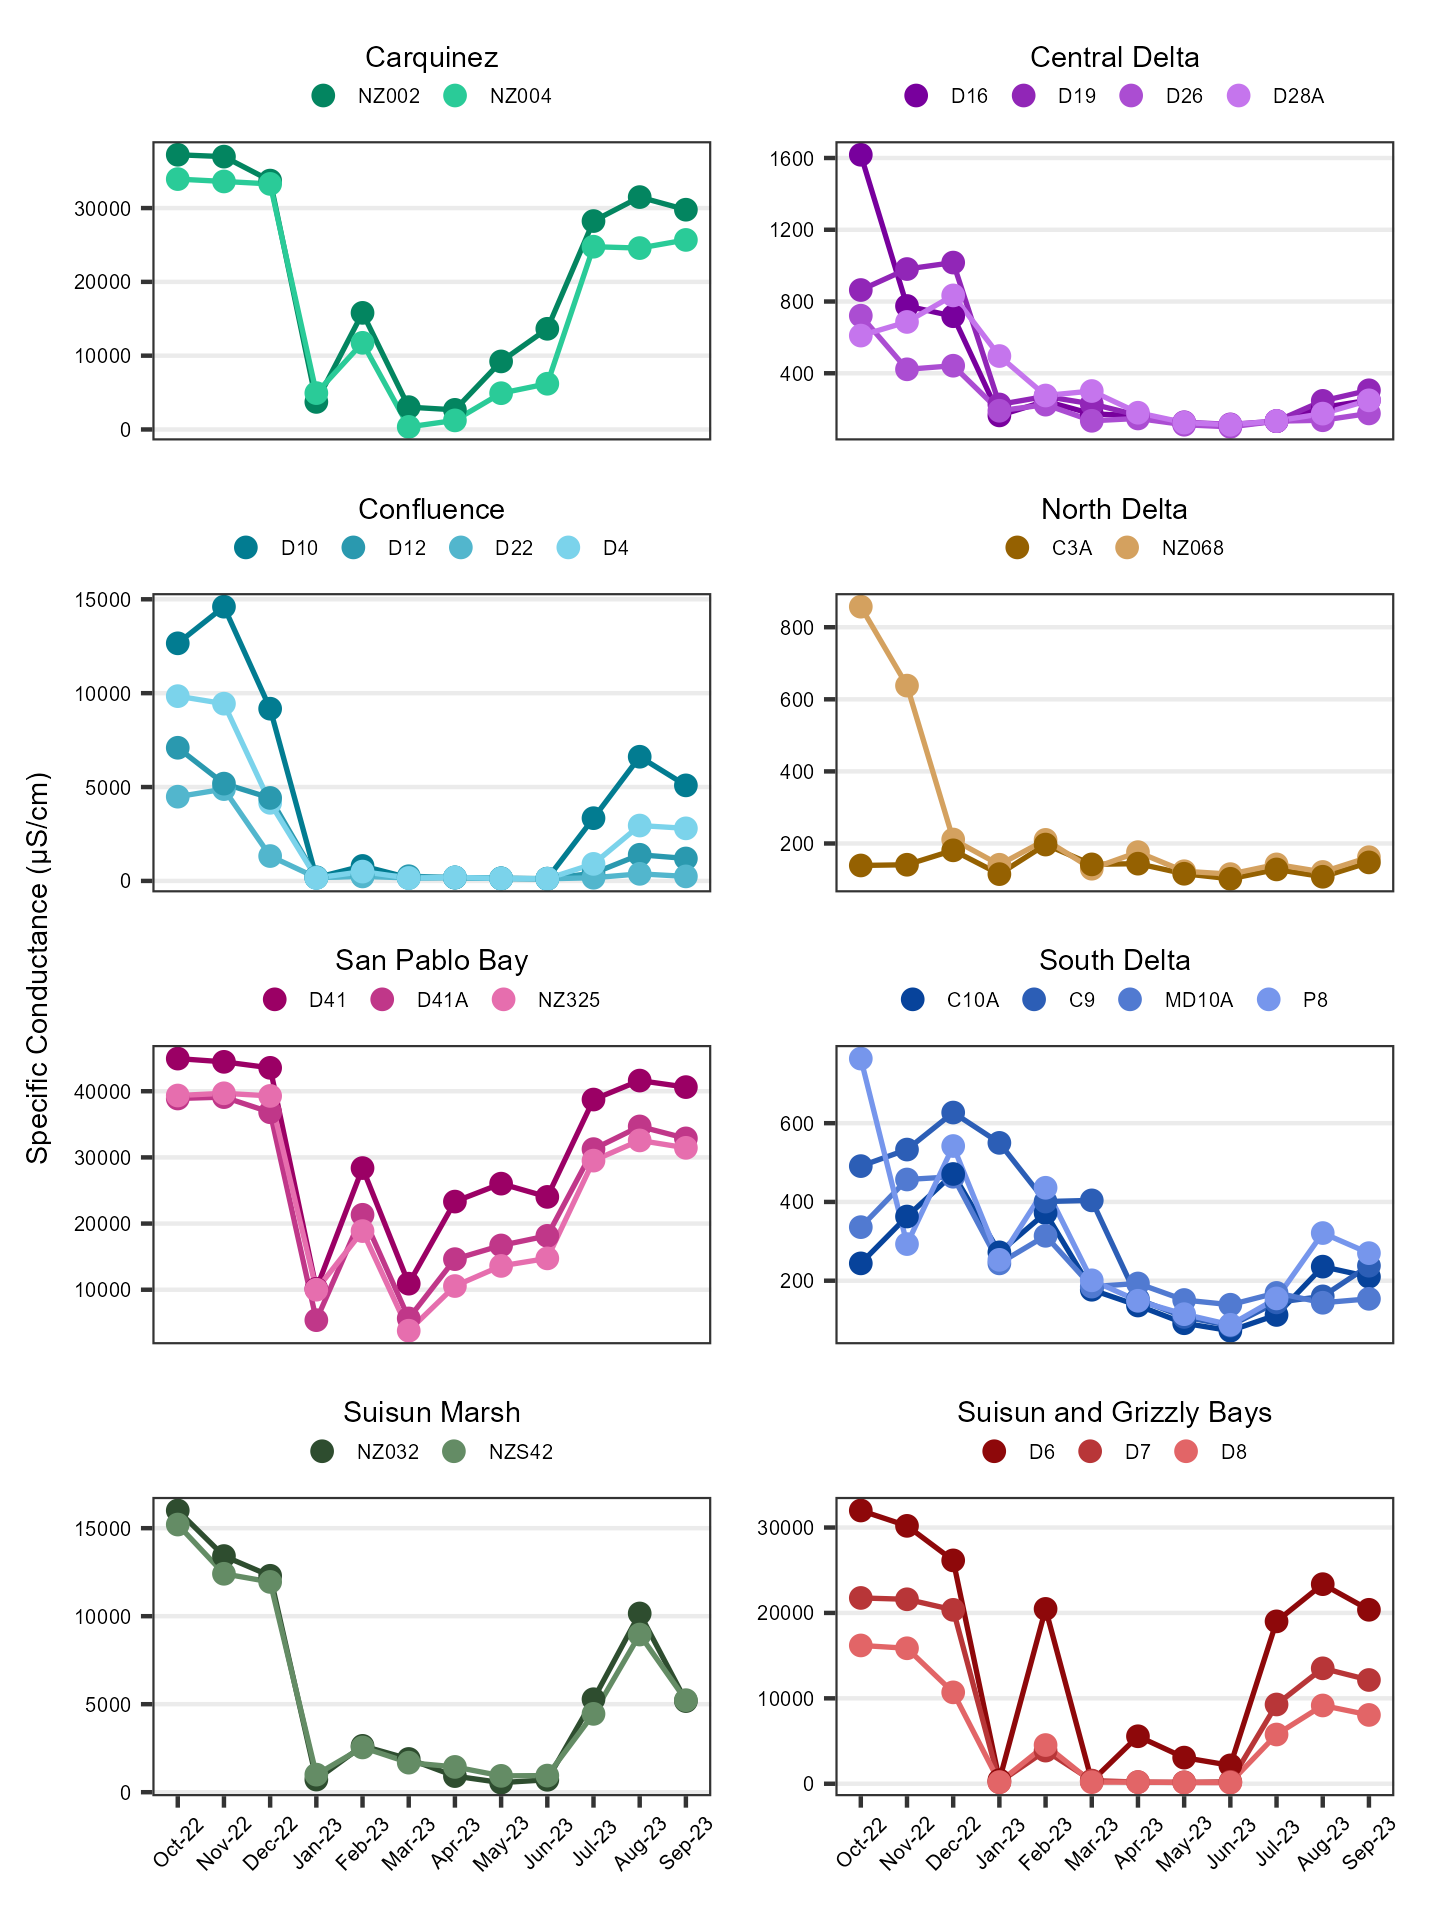
The average specific conductance value was 674 ± 527 µS/cm; for comparison, the previous year average was 538 ± 417 µS/cm. Values ranged from 108 µS/cm to 44700 µS/cm. Per region average, minimum, and maximum values are shown in Table 2; time series plots are shown in Figure 2.
| Statistic | Carquinez | Central Delta | Confluence | North Delta | San Pablo Bay | South Delta | Suisun and Grizzly Bays | Suisun Marsh |
|---|---|---|---|---|---|---|---|---|
| Average | 27000 | 234 | 684 | 157 | 34500 | 328 | 12400 | 4970 |
| Min | 4920 | 134 | 118 | 108 | 12100 | 130 | 222 | 674 |
| Max | 37900 | 1030 | 14100 | 249 | 44700 | 771 | 29800 | 14500 |
Turbidity
The average turbidity value was 9.15 ± 4.85 FNU; for comparison, the previous year average was 11.10 ± 6.00 FNU. Values ranged from 0.40 FNU to 72.20 FNU. Per region average, minimum, and maximum values are shown in Table 3; time series plots are shown in Figure 3.
| Statistic | Carquinez | Central Delta | Confluence | North Delta | San Pablo Bay | South Delta | Suisun and Grizzly Bays | Suisun Marsh |
|---|---|---|---|---|---|---|---|---|
| Average | 12.60 | 3.95 | 10.70 | 5.12 | 12.40 | 5.00 | 13.40 | 31.40 |
| Min | 5.10 | 0.40 | 4.60 | 1.40 | 3.00 | 0.70 | 6.40 | 15.40 |
| Max | 27.90 | 14.90 | 41.00 | 72.20 | 57.20 | 16.80 | 38.90 | 62.10 |

Dissolved Ammonia
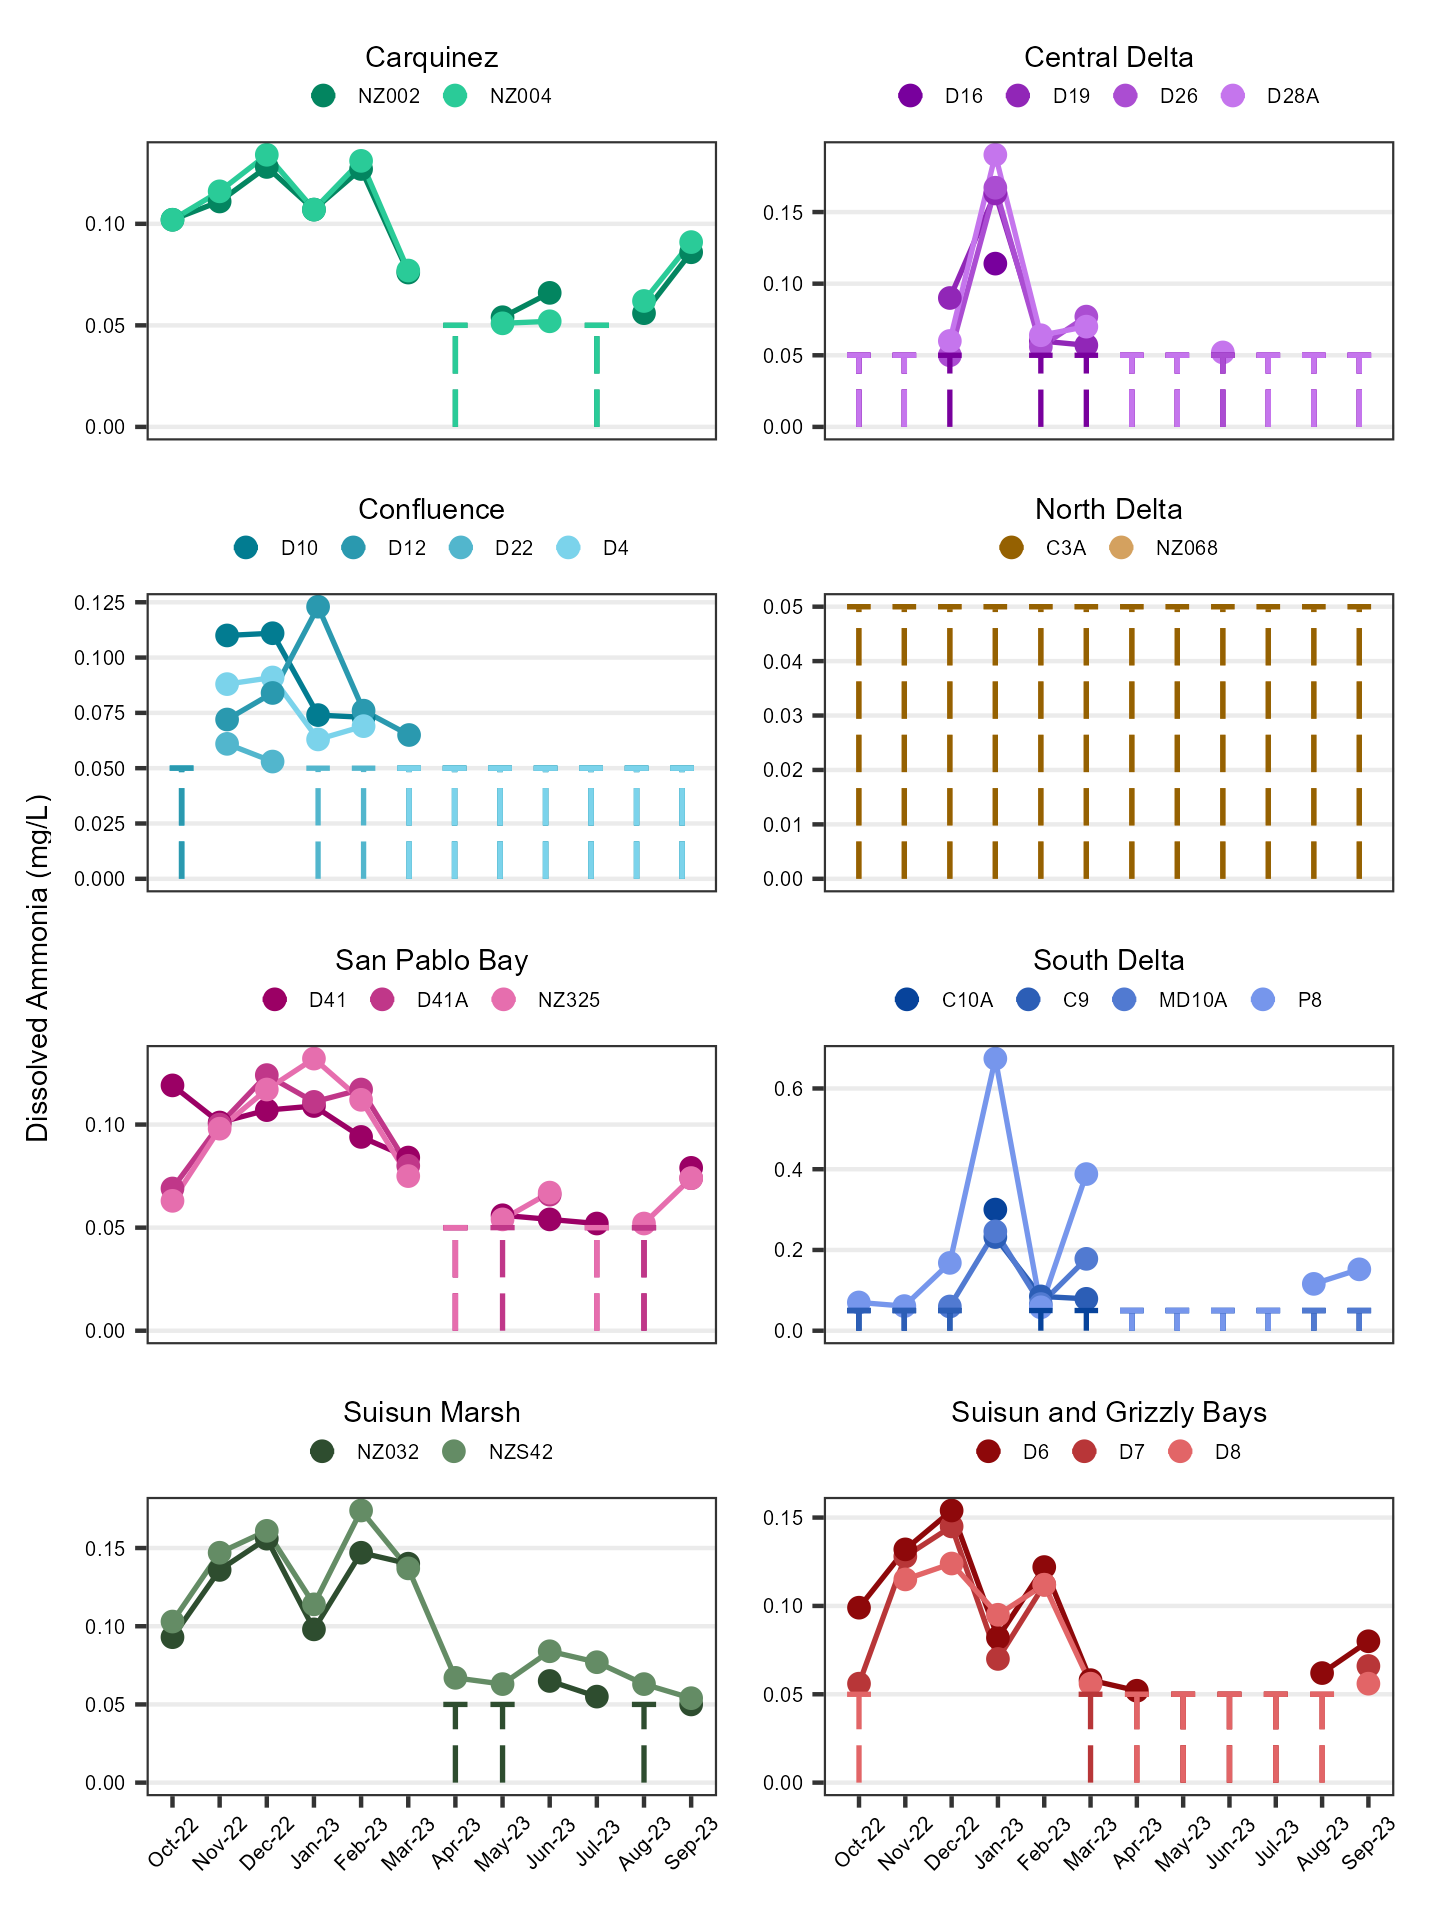
The average dissolved ammonia value was 0.05 ± 0.00 mg/L; for comparison, the previous year average was 0.05 ± 0.00 mg/L. Values ranged from < 0.05 mg/L to 0.62 mg/L. 58.27% of samples were below the reporting limit. Per region average, minimum, and maximum values are shown in Table 4; time series plots are shown in Figure 4.
| Statistic | Carquinez | Central Delta | Confluence | North Delta | San Pablo Bay | South Delta | Suisun and Grizzly Bays | Suisun Marsh |
|---|---|---|---|---|---|---|---|---|
| Average | 0.0905 | 0.05* | 0.05* | 0.05* | 0.081 | 0.05* | 0.0615 | 0.081 |
| Min | 0.05* | 0.05* | 0.05* | 0.05* | 0.05* | 0.05* | 0.05* | 0.05* |
| Max | 0.143 | 0.07 | 0.116 | 0.05* | 0.139 | 0.624 | 0.145 | 0.141 |
| * value is RL |
Chlorophyll a
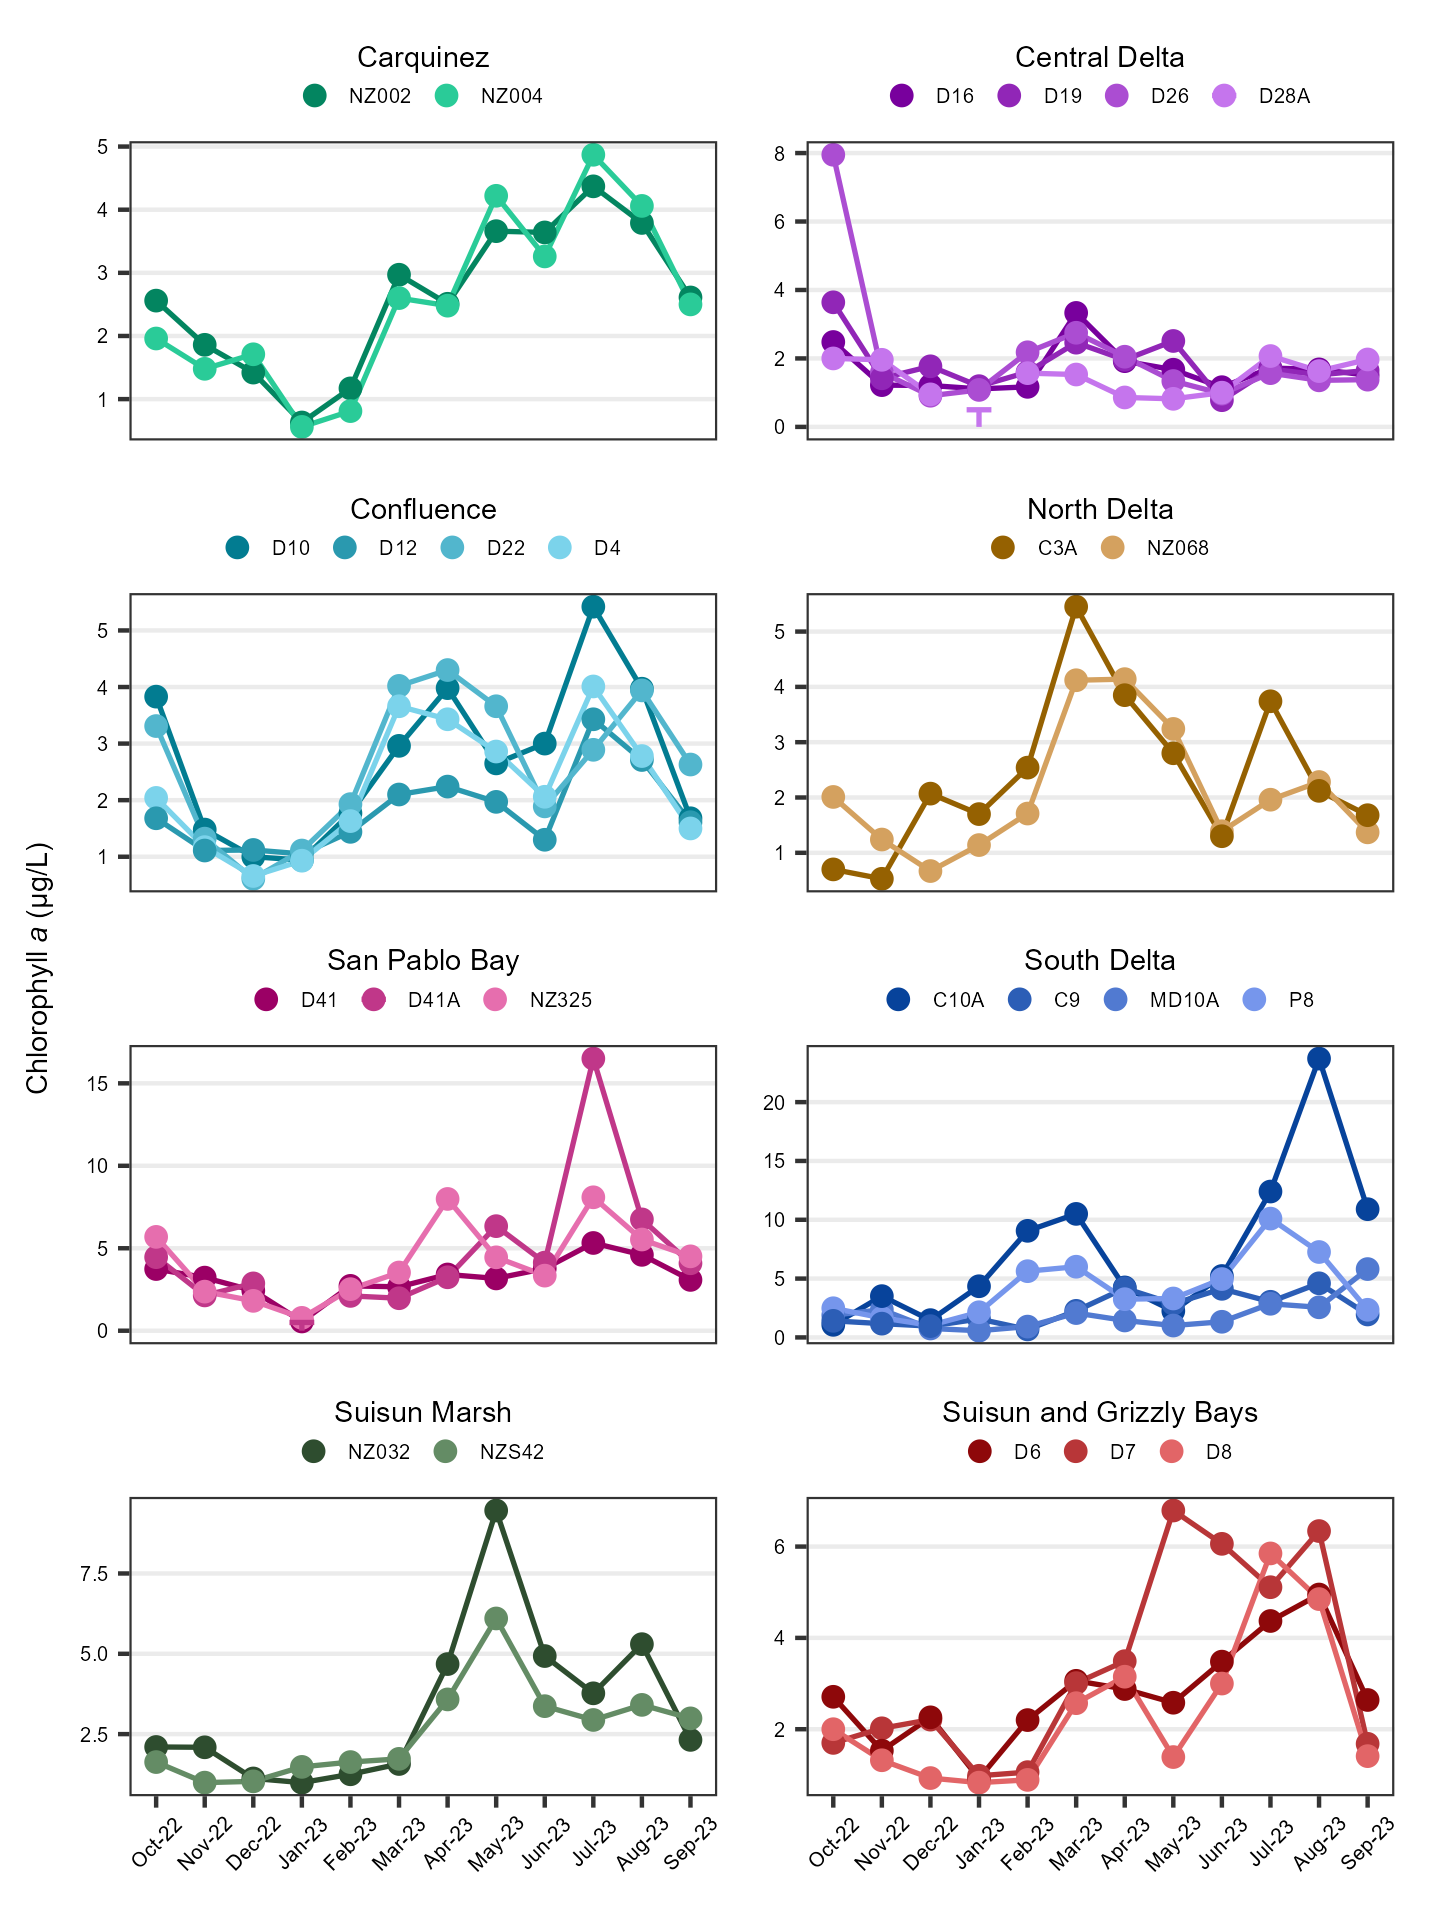
The average chlorophyll a value was 1.96 ± 0.66 µg/L; for comparison, the previous year average was 2.20 ± 0.99 µg/L. Values ranged from 0.59 µg/L to 53.10 µg/L. Per region average, minimum, and maximum values are shown in Table 5; time series plots are shown in Figure 5.
| Statistic | Carquinez | Central Delta | Confluence | North Delta | San Pablo Bay | South Delta | Suisun and Grizzly Bays | Suisun Marsh |
|---|---|---|---|---|---|---|---|---|
| Average | 1.79 | 1.57 | 2.03 | 1.46 | 2.64 | 2.13 | 1.93 | 3.04 |
| Min | 0.89 | 0.59 | 0.86 | 0.76 | 1.29 | 0.74 | 0.90 | 1.28 |
| Max | 4.59 | 4.90 | 4.18 | 4.18 | 5.90 | 53.10 | 7.53 | 8.54 |
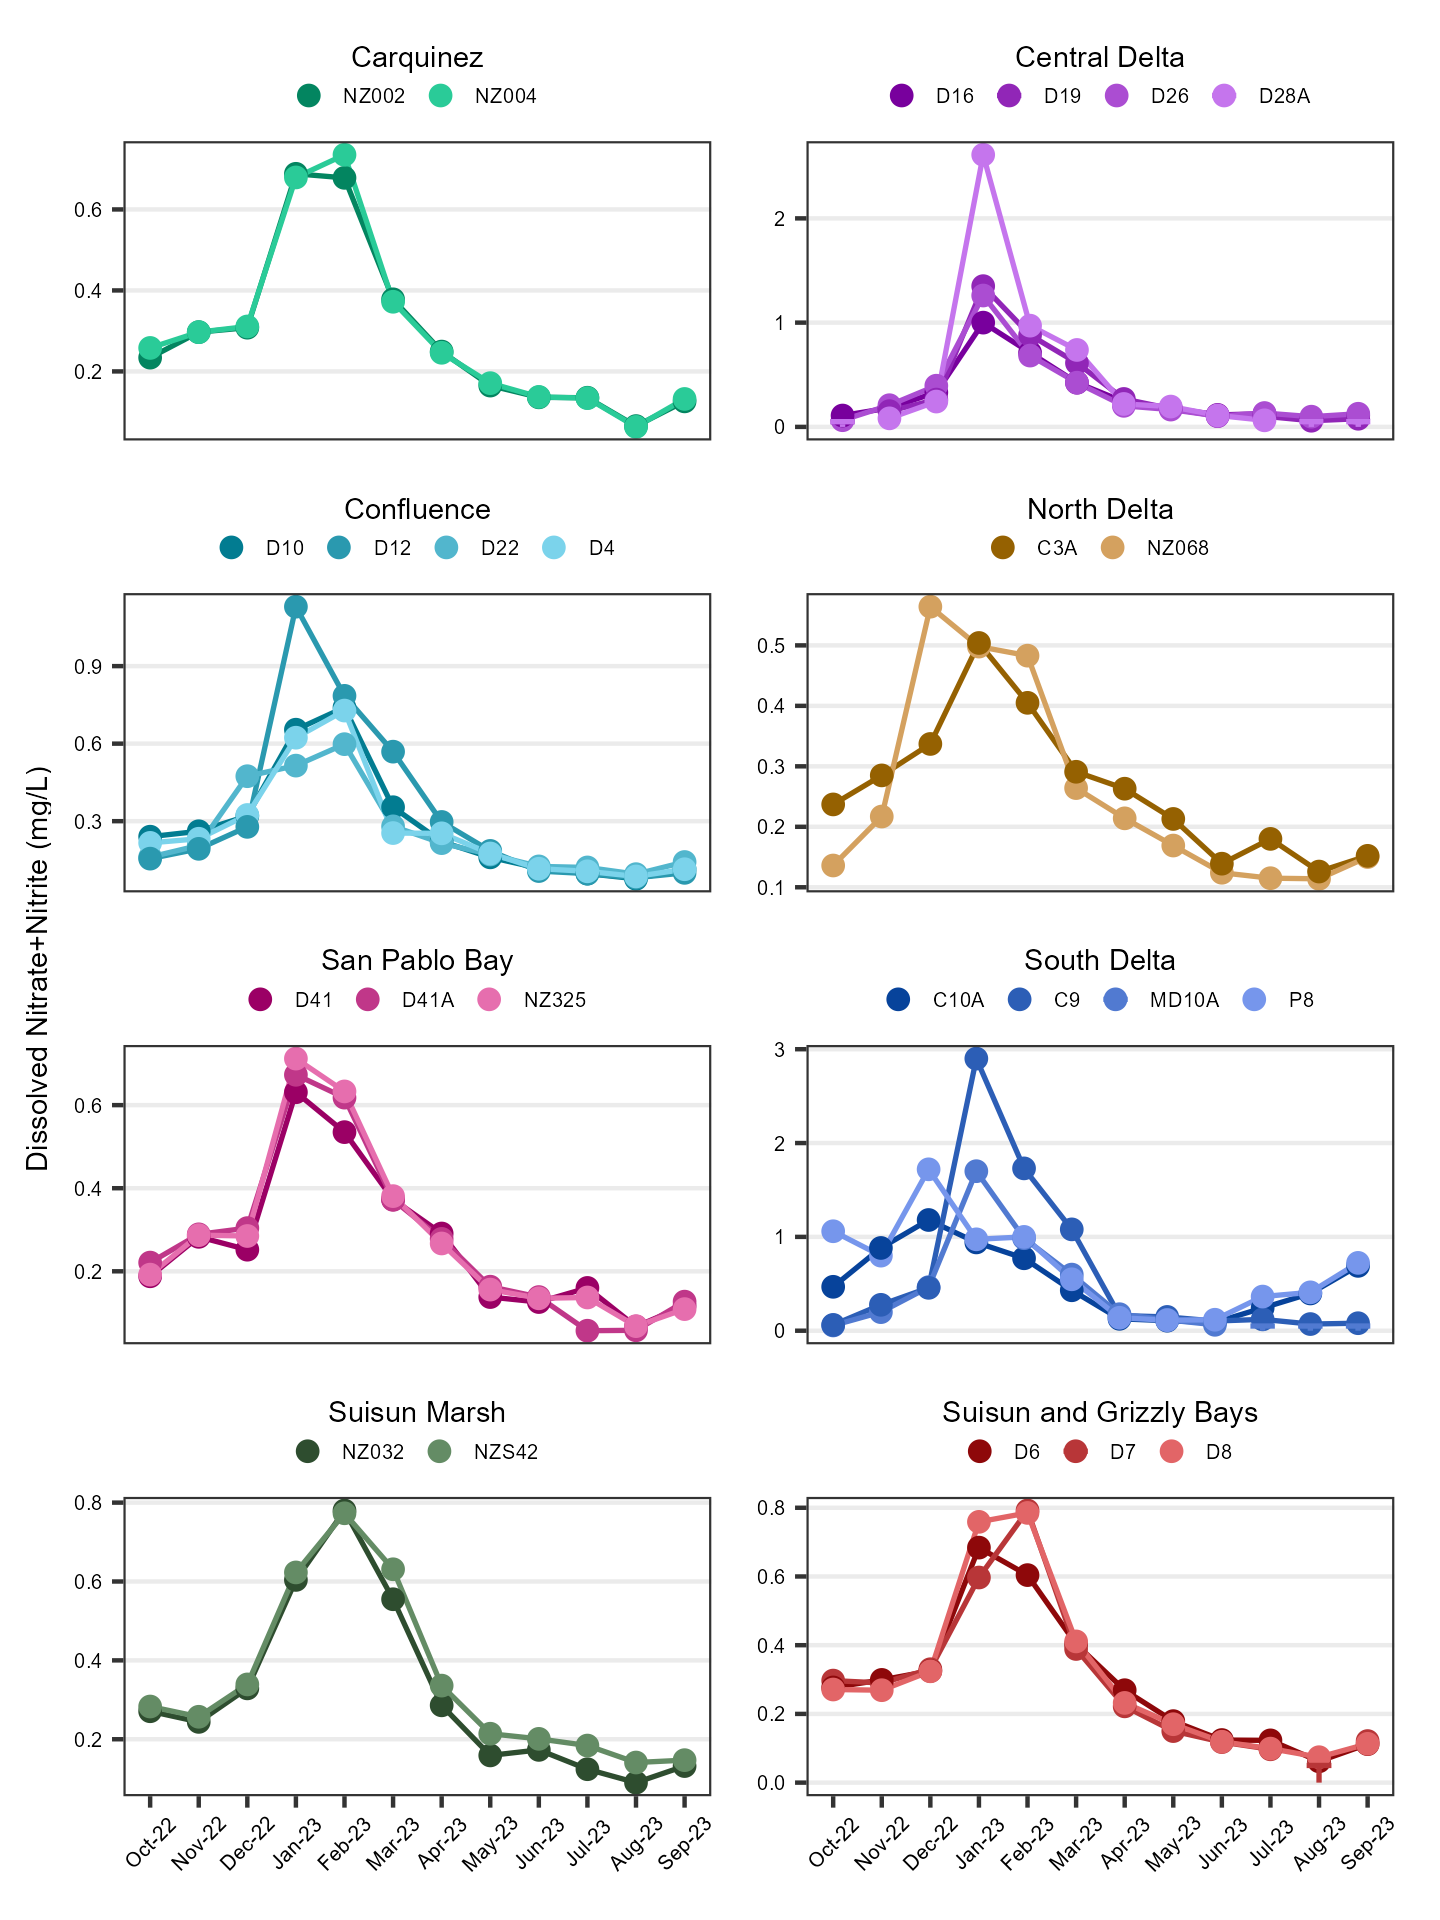
Dissolved Nitrate + Nitrite
The average dissolved nitrate+nitrite value was 0.21 ± 0.08 mg/L; for comparison, the previous year average was 0.22 ± 0.11 mg/L. Values ranged from < 0.05 mg/L to 2.66 mg/L. 5.04% of samples were below the reporting limit. Per region average, minimum, and maximum values are shown in Table 6; time series plots are shown in Figure 6.
| Statistic | Carquinez | Central Delta | Confluence | North Delta | San Pablo Bay | South Delta | Suisun and Grizzly Bays | Suisun Marsh |
|---|---|---|---|---|---|---|---|---|
| Average | 0.22 | 0.1615 | 0.16 | 0.17 | 0.21 | 0.567 | 0.20 | 0.28 |
| Min | 0.15 | 0.05* | 0.06 | 0.08 | 0.11 | 0.05* | 0.14 | 0.12 |
| Max | 0.40 | 0.578 | 0.58 | 0.42 | 0.38 | 2.66 | 0.40 | 0.45 |
| * value is RL |
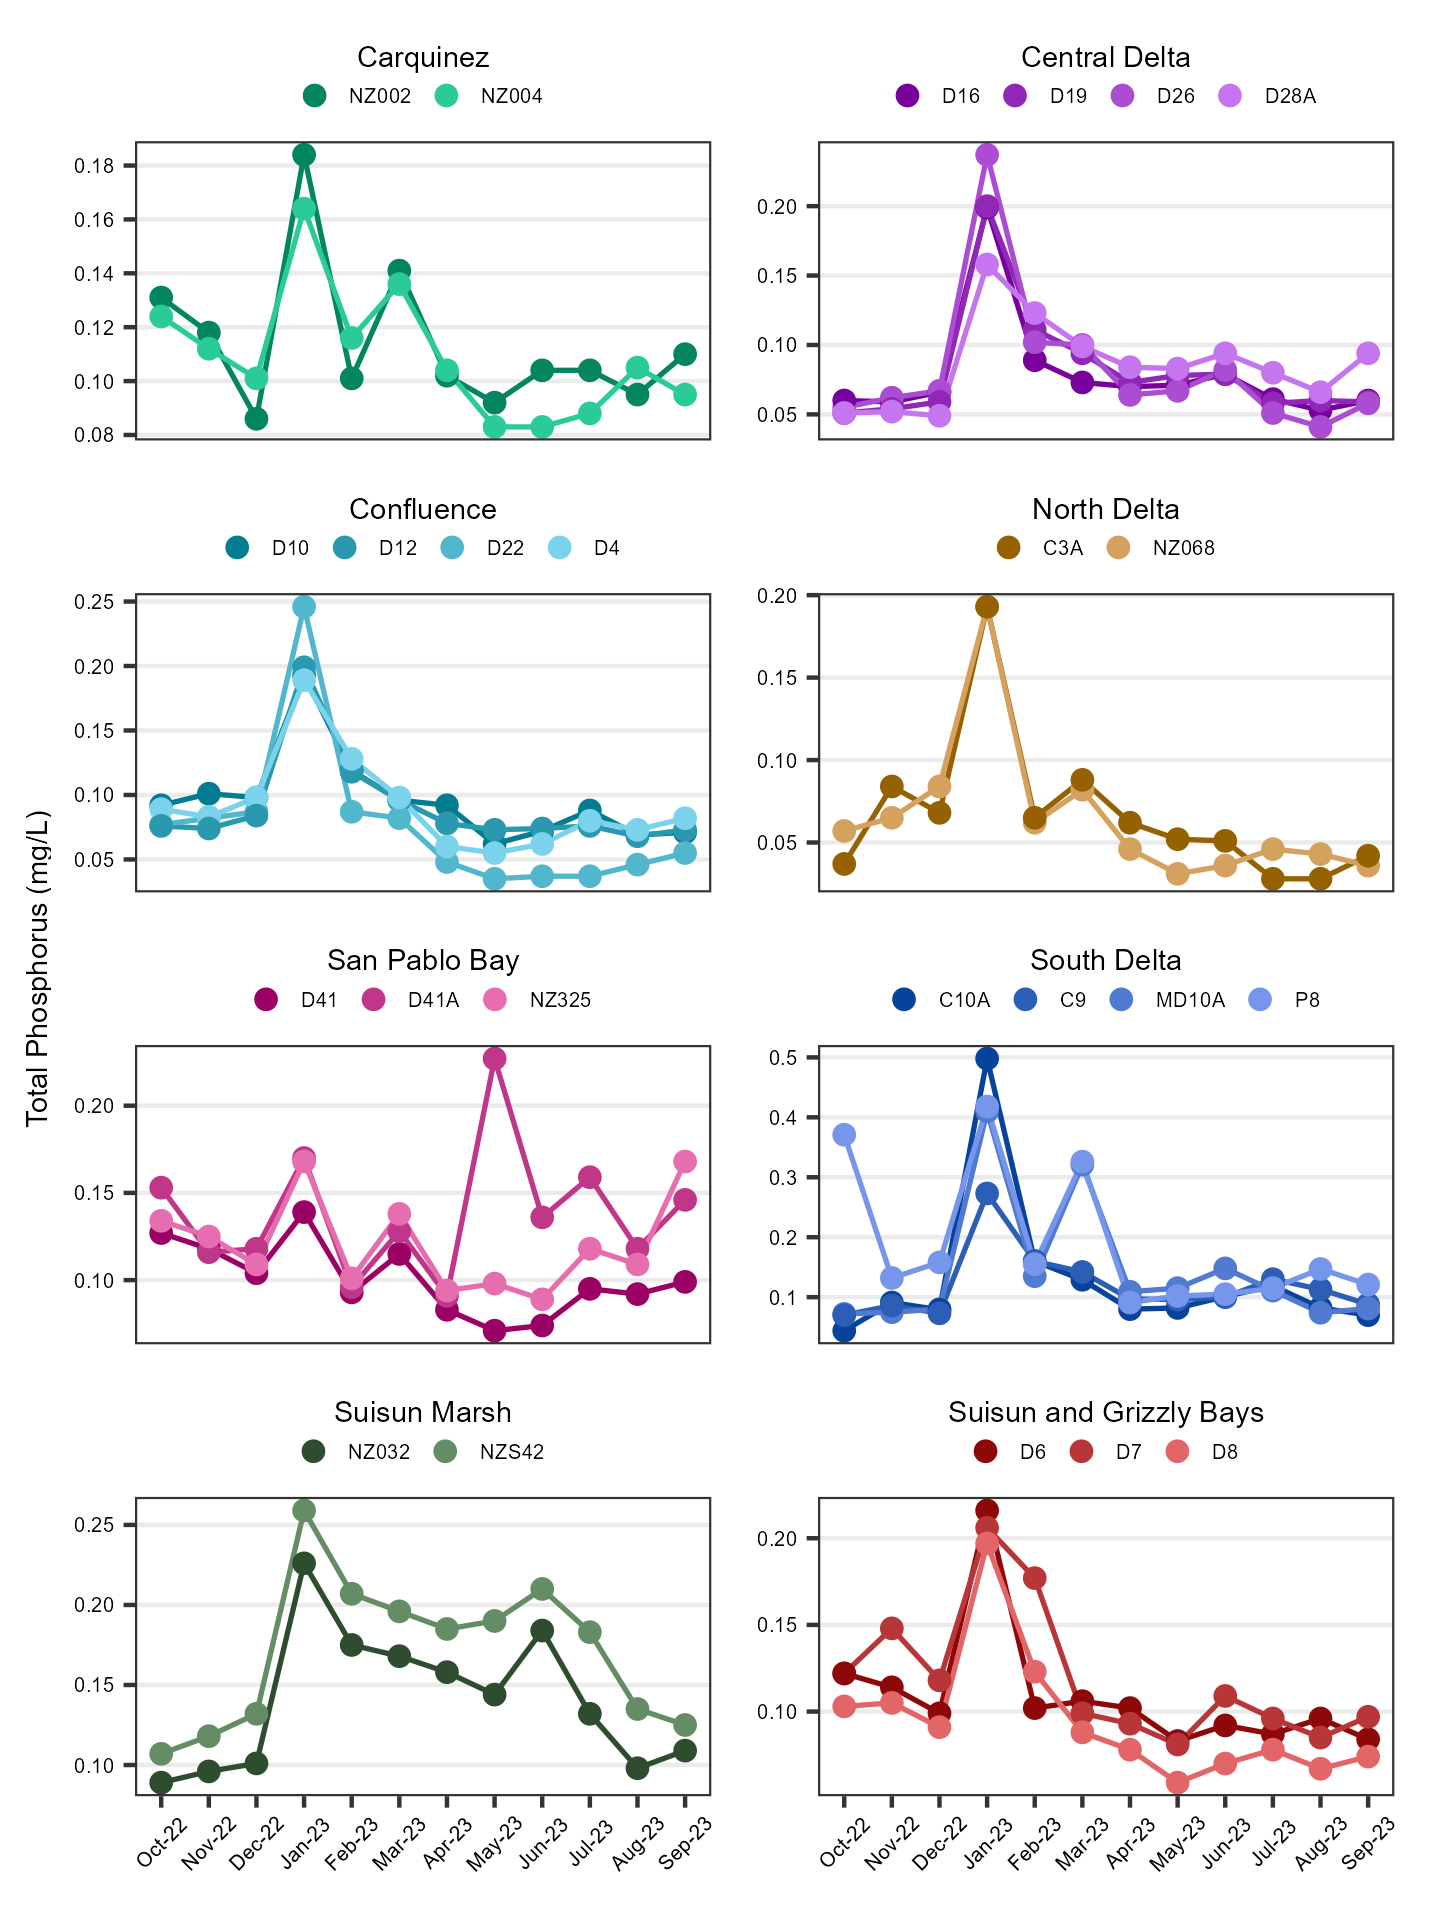
Total Phosphorus
The average total phosphorus value was 0.08 ± 0.02 mg/L; for comparison, the previous year average was 0.10 ± 0.02 mg/L. Values ranged from < 0.01 mg/L to 0.22 mg/L. 0.36% of samples were below the reporting limit. Per region average, minimum, and maximum values are shown in Table 7; time series plots are shown in Figure 7.
| Statistic | Carquinez | Central Delta | Confluence | North Delta | San Pablo Bay | South Delta | Suisun and Grizzly Bays | Suisun Marsh |
|---|---|---|---|---|---|---|---|---|
| Average | 0.10 | 0.06 | 0.07 | 0.05 | 0.098 | 0.10 | 0.09 | 0.13 |
| Min | 0.07 | 0.03 | 0.03 | 0.03 | 0.01* | 0.04 | 0.03 | 0.08 |
| Max | 0.14 | 0.10 | 0.09 | 0.16 | 0.211 | 0.18 | 0.12 | 0.22 |
| * value is RL |
Interpretations
Water year 2024 in the Sacramento and San Joaquin Valleys was classified as above normal. Northern California experienced more atmospheric rivers than the previous year, but they were weaker storms. The majority of those atmospheric rivers made landfall January through March. Then near-record summer air temperatures dried out a lot of California toward the end of the water year.
The average specific conductance in water year 2024 was a little higher than the previous year. All regions had a notable drop after January due to the influx of freshwater. Most regions then had an increase during the summer months due to the high air temperatures. The Carquinez, San Pablo Bay, and Suisun and Grizzly Bay regions typically have higher values due to the strong marine influence from the Pacific Ocean.
The average turbidity in water year 2024 was a little lower than the previous year. Most regions had a spike in February due to sediment re-suspension caused by the high flows after storms. All regions downstream of the Confluence had another spike in May/June after a storm in that area. The Suisun Marsh had the highest values overall.
The average chlorophyll a in water year 2024 was a little lower than the previous year. The average and minimum values were similar in all regions. C10A in the South Delta had a large spike in July, due to aquatic vegetation that accumulated around the station. It is typically shallow during dry parts of the year.
The average dissolved ammonia, dissolved nitrate + nitrite, and total phosphorus in water year 2024 was similar to the previous year. All three nutrients had a slightly higher percentage of samples below the reporting limit than the previous year. Most regions had a spike in January due to increased runoff of organic matter and pollutants after storms. The South Delta region had some of the highest values of all three nutrients, due to nearby agricultural land use.
Archived Reports
Previous EMP discrete water quality reports can be found here.